Sklearn examples
The SklearnMethod provides an interface to use sklearn compatible estimators.
Simple example
This is a simple example of comparing different boosting models with their default configurations for classification tasks:
"""
mlgauge example to compare different boosting models on a classification task.
"""
from mlgauge import Analysis, SklearnMethod
from xgboost import XGBClassifier
from lightgbm import LGBMClassifier
from catboost import CatBoostClassifier
from sklearn.ensemble import GradientBoostingClassifier
import matplotlib.pyplot as plt
SEED = 42
methods = [
(
"xgboost",
SklearnMethod(XGBClassifier(n_jobs=-1, verbosity=0), ["accuracy", "f1_micro"]),
),
(
"lightgbm",
SklearnMethod(LGBMClassifier(n_jobs=-1, silent=True), ["accuracy", "f1_micro"]),
),
(
"catboost",
SklearnMethod(
CatBoostClassifier(thread_count=-1, verbose=False), ["accuracy", "f1_micro"]
),
),
(
"gbm",
SklearnMethod(GradientBoostingClassifier(verbose=0), ["accuracy", "f1_micro"]),
),
]
an = Analysis(
methods=methods,
metric_names=["accuracy", "f1 score"],
datasets="classification",
n_datasets=10,
random_state=SEED,
# use_test_set=False # to use cross-validation
drop_na=True,
)
an.run()
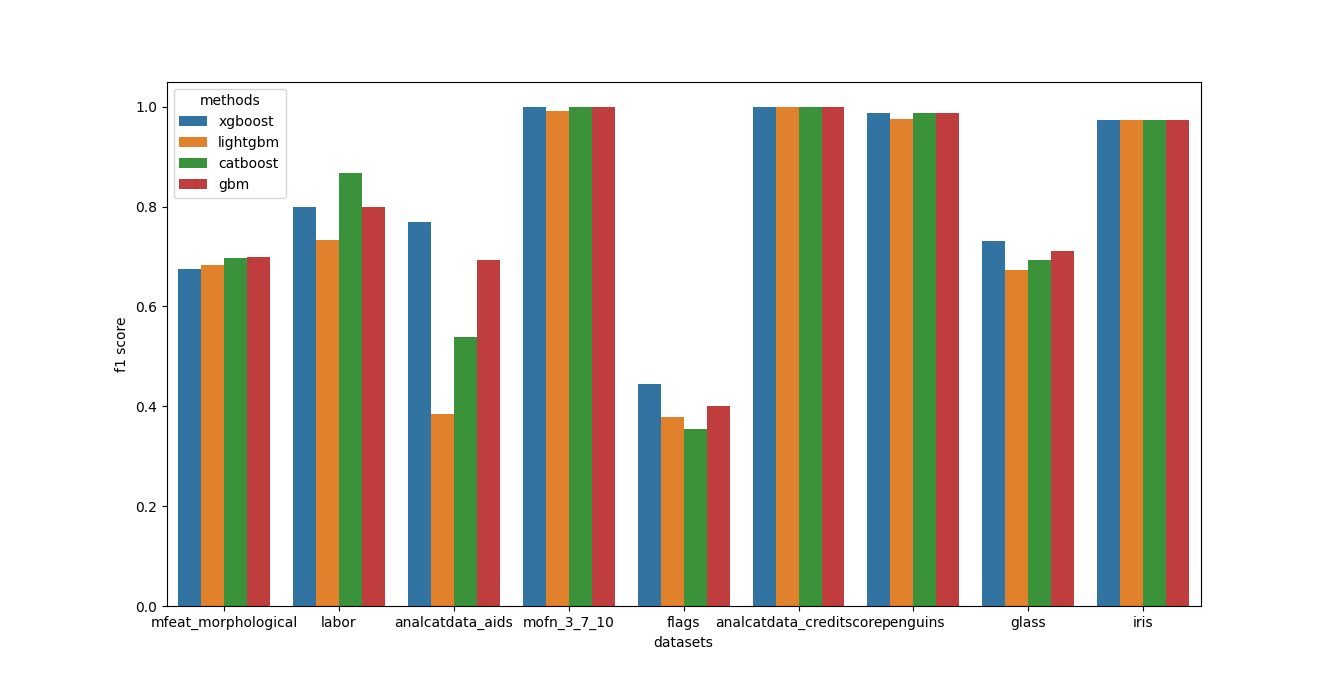
print(an.get_result_as_df("f1 score"))
an.plot_results("f1 score")
plt.show()
Output:
output
                           xgboost  lightgbm  catboost       gbm
 datasets
 mfeat_morphological      0.674000  0.682000  0.698000  0.700000
 labor                    0.800000  0.733333  0.866667  0.800000
 analcatdata_aids         0.769231  0.384615  0.538462  0.692308
 mofn_3_7_10              1.000000  0.990937  1.000000  1.000000
 flags                    0.444444  0.377778  0.355556  0.400000
 analcatdata_creditscore  1.000000  1.000000  1.000000  1.000000
 mfeat_morphological      0.674000  0.682000  0.698000  0.700000
 penguins                 0.988095  0.976190  0.988095  0.988095
 glass                    0.730769  0.673077  0.692308  0.711538
 iris                     0.973684  0.973684  0.973684  0.973684
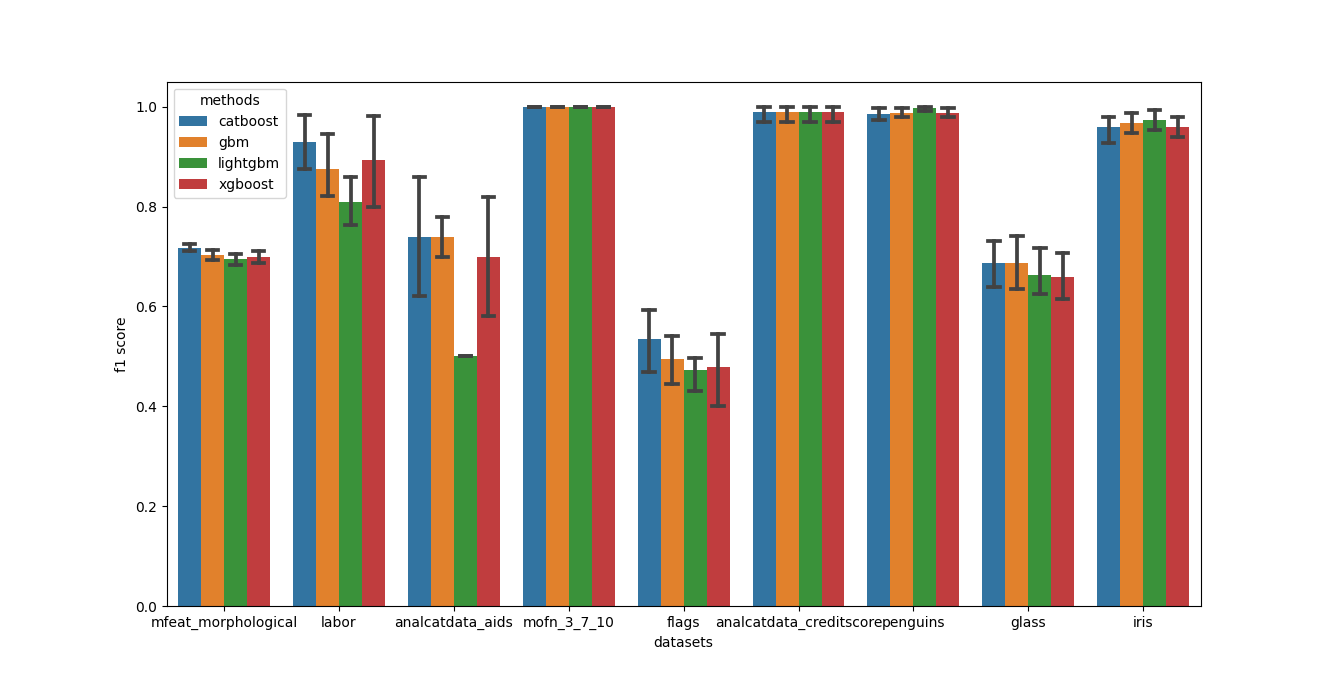
Modifying the code to use 5-fold validation (default) instead of a train-test split by setting the use_test_set parameter of analysis to False gives the following output:
output-cv
                           xgboost            ...       gbm
                              mean       std  ...      mean       std
 datasets                                     ...
 mfeat_morphological      0.698500  0.019468  ...  0.703500  0.015540
 labor                    0.893939  0.104094  ...  0.875758  0.070678
 analcatdata_aids         0.700000  0.141421  ...  0.740000  0.048990
 mofn_3_7_10              1.000000  0.000000  ...  1.000000  0.000000
 flags                    0.478413  0.084229  ...  0.494921  0.053567
 analcatdata_creditscore  0.990000  0.020000  ...  0.990000  0.020000
 mfeat_morphological      0.698500  0.019468  ...  0.703500  0.015540
 penguins                 0.988014  0.011182  ...  0.987969  0.011315
 glass                    0.658537  0.057718  ...  0.687805  0.062470
 iris                     0.960000  0.024944  ...  0.966667  0.021082